The 5 Metrics Every Sales Team Should Track Daily
Most Sales Teams Track The Wrong Metrics, or The Right Metrics at The Wrong Frequency. Here's What Actually Matters.
There's a difference between tracking sales performance and actually understanding it. Most teams have dashboards. Most teams have numbers. But very few teams track the right numbers at the right frequency to actually make better decisions in real time.
We've worked with hundreds of sales organizations — from 3-person closer teams to 50-rep operations doing eight figures a year. And across all of them, the teams that consistently outperform have something in common: they track a small set of metrics every single day, not weekly, not monthly.
Daily.
Not because they're obsessive. Because daily data changes what's possible. It turns management from a rearview-mirror exercise into something that can actually prevent problems before they become revenue losses.
This blog breaks down the five categories of metrics that matter every day, why each one matters, how to think about them, and what most teams get wrong.
Why Daily Matters
Before we get into the specific metrics, it's worth understanding why daily frequency is the threshold that changes everything.
Most sales teams track performance monthly. Some track weekly. A few track daily. The difference in management quality between these groups is enormous, and it's not just about having more data points.
Monthly tracking is autopsy reporting
When you review performance once a month, you're looking at outcomes that have already happened. The month is over. The revenue is what it is. If someone had a bad month, there's nothing you can do about it, you can only hope next month is better.
Monthly tracking tells you what happened. It doesn't help you influence what's happening.
Think about it: If a rep's activity drops on the 5th of the month, but you don't seeit until th 1st of next month, that's 25 days of declining performance that went unaddressed. By the time you notice, the damage is done. The pipeline is thin. The revenue is already going to be short. And the rep has had nearly a month to develop bad habits.
Weekly tracking is better but still reactive
Weekly check-ins give you a faster feedback loop. You can catch a bad week before it becomes a bad month, But a week is still a long time in sales. A rep can have a terrible Monday-through-Thursday and you won't know until Friday's report. That's four days of lost opportunity.
Weekly also introduces a batching problem, Reps don't remember their exact numbers from Monday when they're entering data on Friday. They estimate. They round. They fill in what they think happened rather than what actually happened. The data degrades ith every day of delay.
Daily tracking is where management becomes proactive
When you see today's numbers today, the game changes completely. You can see that someone made half their usual calls this morning and checkin before the day is over. You can see that close rates are trending down this week and adjust the coaching focus before it impacts the month. You can see that a new hire is ramping faster than expected and adjust their targets accordingly.
Daily data doesn't just tell you more, it changes the nature of what management is. It shifts from reviewing outcomes to influencing them in real time. That's the fundamental difference, and it's why the best teams we've worked with are obsessive about daily tracking.
Now, here's the key: you can't track everything daily. If you try to monitor 30 metrics per rep per day, you'll drown in data and actually see less. The art is tracking a focused set of metrics that give you maximum visibility with minimum noise.
Here are the five.
Metric #1: Daily activity Volume
What it is: The total count of primary sales activities each rep performs in a day. Depending on your sales model, this might be calls made, emails sent, DMs sent, doors knocked, demos given, or some combination.
Why is matters daily: Activity volume is the most leading of all leading indicators. It's the thing your reps directly control, and it's the first thing that changes when something goes wrong, before conversion rates drop, before revenue dips, activity drops.
When a rep is getting burned out, their calls drop first. When a rep is about to quit, their activity trails off weeks before they give you notice. When a rep has a personal issue affecting their work, it' shows up in activity before it shows up anywhere else. Daily activity data is your earliest warning system.
How to think about it
Don't just look at the raw number in isolation. Activity volume is most useful when you compare it to three things:
1. Their own baseline. Is this rep above or below their personal average? A rep who averages 50 calls and made 30 today is a concern. A repwhoaverages 25 and made 30 is having a great day. The same number means completely different things depending on the individual.
2. The team average. How does each rep's daily activity compare to the rest of the team? This isn't about shaming low performers, it's about identifying coaching opportunities and spotting patterns. If your top three reps are all below average today, something systemic might be off (bad leads, system issues, team morale).
3. What's required to hit their goal. If a rep needs 40 closes this month and historically converts at 5% from calls, they need 800 calls in the month, which is roughly 40 per day. If they're averaging 30, they're going to miss, and you can see that on day 3, not day 30.
What most teams get wrong
The biggest mistake is treating activity volume as the only metric that matters. We've seen managers who are laster-focused on call counts but blind to conversion efficiency. They reward the rep making 80 calls with a 2% close rate over the rep making 40 calls with a 6% close rate. The second rep is producing more revenue with less effort, but the dashboard only shows who's "working harder."
Activity volume is necessary but not sufficient. It answers "are they doing enough?" but not "are they doing it well?" That's where the next metric comes in.
Metric #2: Conversion Rate
What it is: The percentage of one activity that converts to the next stage. Call-to-appointment rate. Appointment-to-show rate. Show-to-close rate. The specific stages depend on your sales process, but every team has conversion points between activities and outcomes.
Why it matters daily: Conversion rates reveal efficiency. Two reps can have identical activity volumes but wildly different outcomes based on how well they convert. Daily conversion data lets you see these differences in real time and address them through coaching, script changes, or process adjustments before they compount into a bad month.
The conversion chain
In most sales operations, there's a chain of conversions that looks something like this:
Calls >> Conversations >> Appointments Set >> Appointments Shown >> Closes >> Revenue
Each arrow represents a conversion point, and each conversion point is a potential leak in the funnel. When revenue is down, the question isn't just "what happened?", it's "where in the chain did it break?"
Maybe the rep is making enough calls but their conversation rate dropped, which suggests a lead quality issue or a first-touch script problem. Maybe they're setting plenty of appointments but shows are down, which is a follow-up or confirmations process issue. Maybe shows are fine but closes dropped, which is a presentation or objection-handling problem.
Without daily conversion data at each stage, you can't diagnose where the leak is. You just know "revenue is down" and you start guessing.
Daily tracking lets you poinpoint the exact stage where performance diverged from normal, so your coaching is targeted rather than generic.
How to think about it
Conversion rates fluctuate day-to-day, and that's normal. A single day's close rate isn't necessarily meangingful, small sample sizes make daily rates volatile. What you're watching for is trends over 3-5 days.
If a rep's call-to-appointment rate has been declining for three consectuive days, that's a pattern worth investigating even if no single day's rate looks alarming. By day five, it's almost certainly not statistical noise, something changes, and you need to find out what.
The most powerful use of daily conversion data is comparing a rep's current rates to their own historical average. Every rep has a "normal" conversion profile. When someone deviates from their own normal, it's a signal. When the whole team deviates from normal, it's a systemic issue (lead quality, marketing conditions, tool problems).
What most teams get wrong
Two common mistakes:
Only tracking the final conversion (close rate) and ignoring the stages. If you only knowthatsomeone's close rate dropped from 22% to 14%, you don't know why. Was it fewer shows? Worse presentations? Lower quality appointments? Without stage-by-stage data, every coaching conversation starts with guessing.
Comparing reps to each other instead of to themselves. A closer who works a high-ticket offer with a 12% close rate isn't performing worse than a closer on a low-ticket offer with a 25% close rate. The products, price points, and lead quality are different. The more meaningul comparison is each rep vs. their own historical performance. When their numbers change relative to their baseline, that's the signal.
Metric #3: Revenue (and revenue per activity)
What it is: Total revenue closed per day, and the derived metric of revenue generated per primary activity (revenue per call, revenue per demo etc.).
Why it matters daily: Revenue is the outcome everyone cares about, but daily revenue data is most powerful when paired with activity and conversion data. Alone, it's a lagging indicator. Combined with the other metrics, it becomes a diagnotic tool.
Revenue per activity is the hidden gem
Total daily revenue is useful but noisy. Big deals close on random days. Some days have zero closes and that's fine. But revenue per call (or revenue per demo, revenue per appointment, what your primary top-of-funnel activity is) smooths out the noise over time and tells you something much more important: how much is each unit of effort worth?
Here's why this matters: if a rep's revenue per call is $45 and they make 40 calls a day, you can project their daily revenue capacity at $1,800. Over a 22-day month, that's roughly $39,600. Now you have a predictive model that connects daily activity to monthly revenue, and you can see it today, not at the end of the month.
If their revenue per call drops from $45 to $30, you know immediately that something changed, eveniftheir activity volume hasn't changed. It might be a conversion issue (fewer closes per call), a deal size issue (closing smaller deals), or a lead quality issue (working worse prospects). Each diagnosis leads to a different coaching intervention.
How to think about it
Revenue per activity is best viewed as a rolling average (7-day or 14-day) rather than a single day's snapshot. This smooths out the natural volatility of deals closing on different days while still giving you a responsive signal.
When the rolling average moves up, somthing good is happening, better leads, better skills, better pricing, or better targeting. When it moves down, something needs attention. The trend is the signal, not the daily number.
This metric also helps you make smarter hiring and scaling decisions. If you know that the average rep rgenerates $42 in revenue per call, and you want to add $100k/month in revenue, you can calculate exactly how many calls (and therefore how many reps at their current activity level) you need. It turns scaling from a gut decision into a math problem.
What most teams get wrong
Tracking revenue without connecting it to the activity that produced it. "$200K this month" is a number, not an insight. "$200K from 4,400 calls at $45 /call with a 22% close rate and a $4,800 average deal size" is a full picture that you can optimize, project, and diagnose when it changes.
Panicking over daily revenue fluctuations. Revenueis lumpy. A $0 day followed by a $15K day is normal in most sales models. The managers who react to every daily swing create anxiety without improving performance. Look at the trend, not the day.
Metric #4: Pacing vs. goal
What it is: Where each rep currently stands relative to their monthly (or weekly) target, based on the days elapsed and their current trajectory.
Why it matters daily: This is the metric that turns data into action. Knowing someone made 35 calls today is information. Knowing they're at 62% of their monthly goal with 45% of the month remaining is a situation that demands a response.
Simple pacing vs. intelligent pacing
Simple pacing is linear: if you're on day 10 of a 22 -day month and you've hit 45% of your goal, you're on track (because 10/22 = 45%). This is better than nothing but it's crude. It assumes every day is equal, that Mondays produce the same as Fridays, that the first week of the month is the same as the last.
Intelligent pacing uses the rep's actual daily run rate to project where they'll finish. If someone has averaged $1,800/day over the last 7 days and there are 12 days left in the month, their projection adjusts every day based on real performance, not a linear assumption.
This is enormously powerful for daily management. On day 12, you can look at the team and immediately see:
1. Who's on track to beat their goal (leave them alone)
2. Who's slighlty behind and needs a small push (light coaching, encouragement)
3. Who's significantly behind and needs intervention (deep dive, skill assessment, possible reassignment)
4 .Who's way ahead and might be sandbagging toward the end (stretch goal opportunity)
Without pacing data, every rep looks the same until the last few days of the month when it's too late to do anything about it. With pacing data, you have 22 chances to intervene instead of one.
How to think about it
Pacing should be the first thing a sales manager looks at every morning. Not total revenue. Not activity. Pacing. Because pacing is the synthesis, it combines everything into a single answer to the question: "Is this person going to hit their number?"
Think of it like a GPS. Total revenue tells you where you are. Pacing tells you whether you're going to arrive on time. A GPS that only shows your current location without an ETA is technically correct but functionally useless for making decisions about whetherto speed up, take a detour,or accept that you'll be late.
What most teams get wrong
Not having pacing at all. This is shockingly common. Teams track activity and revenue but don't project where each rep is going to land. The manager has to do the math in their head — or more commonly, just waits until the end of the month and finds out.
Using pacing as a punishment tool. "You're at 35% and we're halfway through the month" shouldn't be delivered as an accusation. It should be the start of a diagnostic conversation: "Let's look at what's different this month. Are the leads different? Did something change in your process? What can we adjust for the next 11 days?" Pacing data enables coaching. How you use it determines whether it helps or hurts morale.
Metric #5: Submission consistency
What it is: Whether each rep actually submitted their numbers today. Not what the numbers are — just whether they exist.
Why it matters daily: This is the meta-metric — the metric about the metrics. Because none of the other four metrics mean anything if the data isn't being submitted consistently.
This sounds obvious, but the number of sales teams that have incomplete data on any given day is staggering. In our experience, a typical team using spreadsheets for daily tracking has a submission rate of about 70-80% on any given day. That means on a team of 10, two or three people didn't submit today. And tomorrow it'll be a different two or three. And by the end of the week, you have gaps everywhere.
Why people don't submit
It's rarely malicious. People don't skip submission because they're hiding something (usually). They skip because:
1) It takes too long. If the submission process involves opening a spreadsheet, finding your row, scrolling to the right column, and entering data without accidentally breaking a formula, it's a 2-3 minute task. That's long enough to skip when you're busy.
2) They forgot. There's no reminder, no notification, no consequence. The day got busy, they drove home, and by the time they remember, it's 10 PM and they figure they'll do it tomorrow (they won't).
3) They don't see the point. If the manager never references the data, never uses it in coaching conversations, never acknowledges submissions — why bother? The data has to go somewhere for people to feel like entering it matters.
4) They had a bad day. This is human nature. When someone made 15 calls instead of their usual 40, the last thing they want to do is publicly log that number. The shame of a bad day becomes a barrier to submission. Over time, this creates a selection bias where only good days get reported, making the data unreliable.
How to think about it
Submission consistency should be treated as a team health metric, not an individual performance metric. If one person doesn't submit, that's a personal accountability issue. If five people don't submit, that's a system issue — the process is too hard, too slow, or not valued enough.
The target should be 95%+ daily submission across the team. Every day. Not "most people, most days." If you can't consistently get above 90%, the problem isn't your team's discipline — it's the tool or process you're asking them to use.
The fastest way to improve submission rates is to reduce friction. Every second you remove from the submission process increases the percentage of people who will do it consistently. This is why we obsess over the 30-second threshold — it's not an arbitrary number, it's the point where submission becomes easy enough that most people will do it without thinking about it.
What most teams get wrong
Not tracking submission at all. Many managers assume everyone is submitting because there are numbers in the spreadsheet. They don't check for gaps. They don't notice that Tuesday is always missing for two people. They just look at the totals and assume the inputs are complete.
Treating non-submission as insubordination instead of a UX problem. When reps don't submit, the first question shouldn't be "why won't they follow instructions?" It should be "is the submission process fast and easy enough?" If you fix the friction, submission rates almost always improve without any disciplinary conversations.
How these five metrics work together
Individually, each of these metrics tells you something useful. Together, they give you a complete operating picture of your sales team — in real time, every day.
Here's how the diagnostic flow works when something looks off:
Step 1: Check pacing. Is the rep (or team) on track to hit their goal? If yes, no intervention needed. If no, move to step 2.
Step 2: Check activity volume. Are they doing enough? If activity is below their baseline, that's the problem — they need to do more. Coach on discipline, time management, motivation. If activity is normal, the problem isn't effort — move to step 3.
Step 3: Check conversion rates. If activity is normal but pacing is off, something in the conversion chain is breaking. Look at each stage: call-to-appointment, appointment-to-show, show-to-close. Find the stage where the rate dropped. That's where to focus coaching.
Step 4: Check revenue per activity. If conversions look normal but revenue is still off, it might be a deal size issue. Are they closing the same number of deals at lower values? Are they discounting more? Is the product mix shifting?
Step 5: Check submission consistency. If the data doesn't make sense, check whether the inputs are complete. Gaps in submission can make all the other metrics look wrong simply because the denominator is incomplete.
This diagnostic flow takes about 60 seconds per rep when the data is clean and available. Over a 15-person team, that's 15 minutes of your morning to understand exactly where every person stands, what's working, and what needs attention. Try doing that with a monthly report.
What you don't need to track daily
Just as important as knowing what to track is knowing what not to track daily. More metrics isn't better — it's noisier. Here are some things that are valuable but don't need daily frequency:
Pipeline value. Important for forecasting but doesn't change meaningfully day-to-day. Weekly is fine.
Customer lifetime value. Strategic metric for product and pricing decisions. Monthly or quarterly review.
Cost per acquisition. Important for marketing and unit economics. Weekly or monthly depending on volume.
Win/loss reasons. Qualitative and important for strategy. Review monthly with a sample of recent deals.
Ramp time for new hires. Track it, but it's a cohort metric measured over weeks, not days.
The principle: daily tracking is for operational metrics that directly indicate whether your team is executing today. Everything else can live on a different cadence. When you try to cram everything into a daily review, you end up looking at nothing closely enough to be useful.
The compound effect of daily tracking
The real magic of daily tracking isn't in any single day's data. It's in the compound effect over time.
When you track daily for a month, you don't just have 22 data points per rep. You have a high-resolution picture of every rep's patterns, tendencies, strengths, and weaknesses. You know who starts strong on Mondays and fades by Thursday. You know who is consistent and who is volatile. You know exactly when someone's performance started to change, not approximately.
Over a quarter, daily tracking gives you enough data to identify systemic patterns. Maybe close rates drop every time you switch lead sources. Maybe activity always dips the week after a team event. Maybe your best reps have a specific activity pattern that correlates with their success — and you can teach that pattern to everyone else.
Over a year, daily tracking gives you a deep, data-backed understanding of your sales operation that no amount of gut feel or monthly reporting can match. You can model scenarios. You can predict outcomes. You can make hiring, firing, training, and compensation decisions based on evidence rather than intuition.
None of this is possible with weekly data. It's certainly not possible with monthly data. The resolution is too low. It's like trying to watch a movie at one frame per second — you can sort of tell what's happening, but you miss everything that matters.
Getting started
If you're not tracking any of these five metrics daily today, don't try to implement all of them at once. Here's a reasonable progression:
Week 1: Track daily activity volume and submission consistency. Get the habit of daily submission established first. This is the foundation — nothing else works if people aren't submitting consistently.
Week 2-3: Add revenue tracking. Now you have inputs (activity) and outputs (revenue), which lets you calculate basic conversion and revenue per activity metrics.
Week 4+: Add pacing vs. goal. This requires a bit more setup (you need defined targets) but it's where the daily data becomes truly actionable for management.
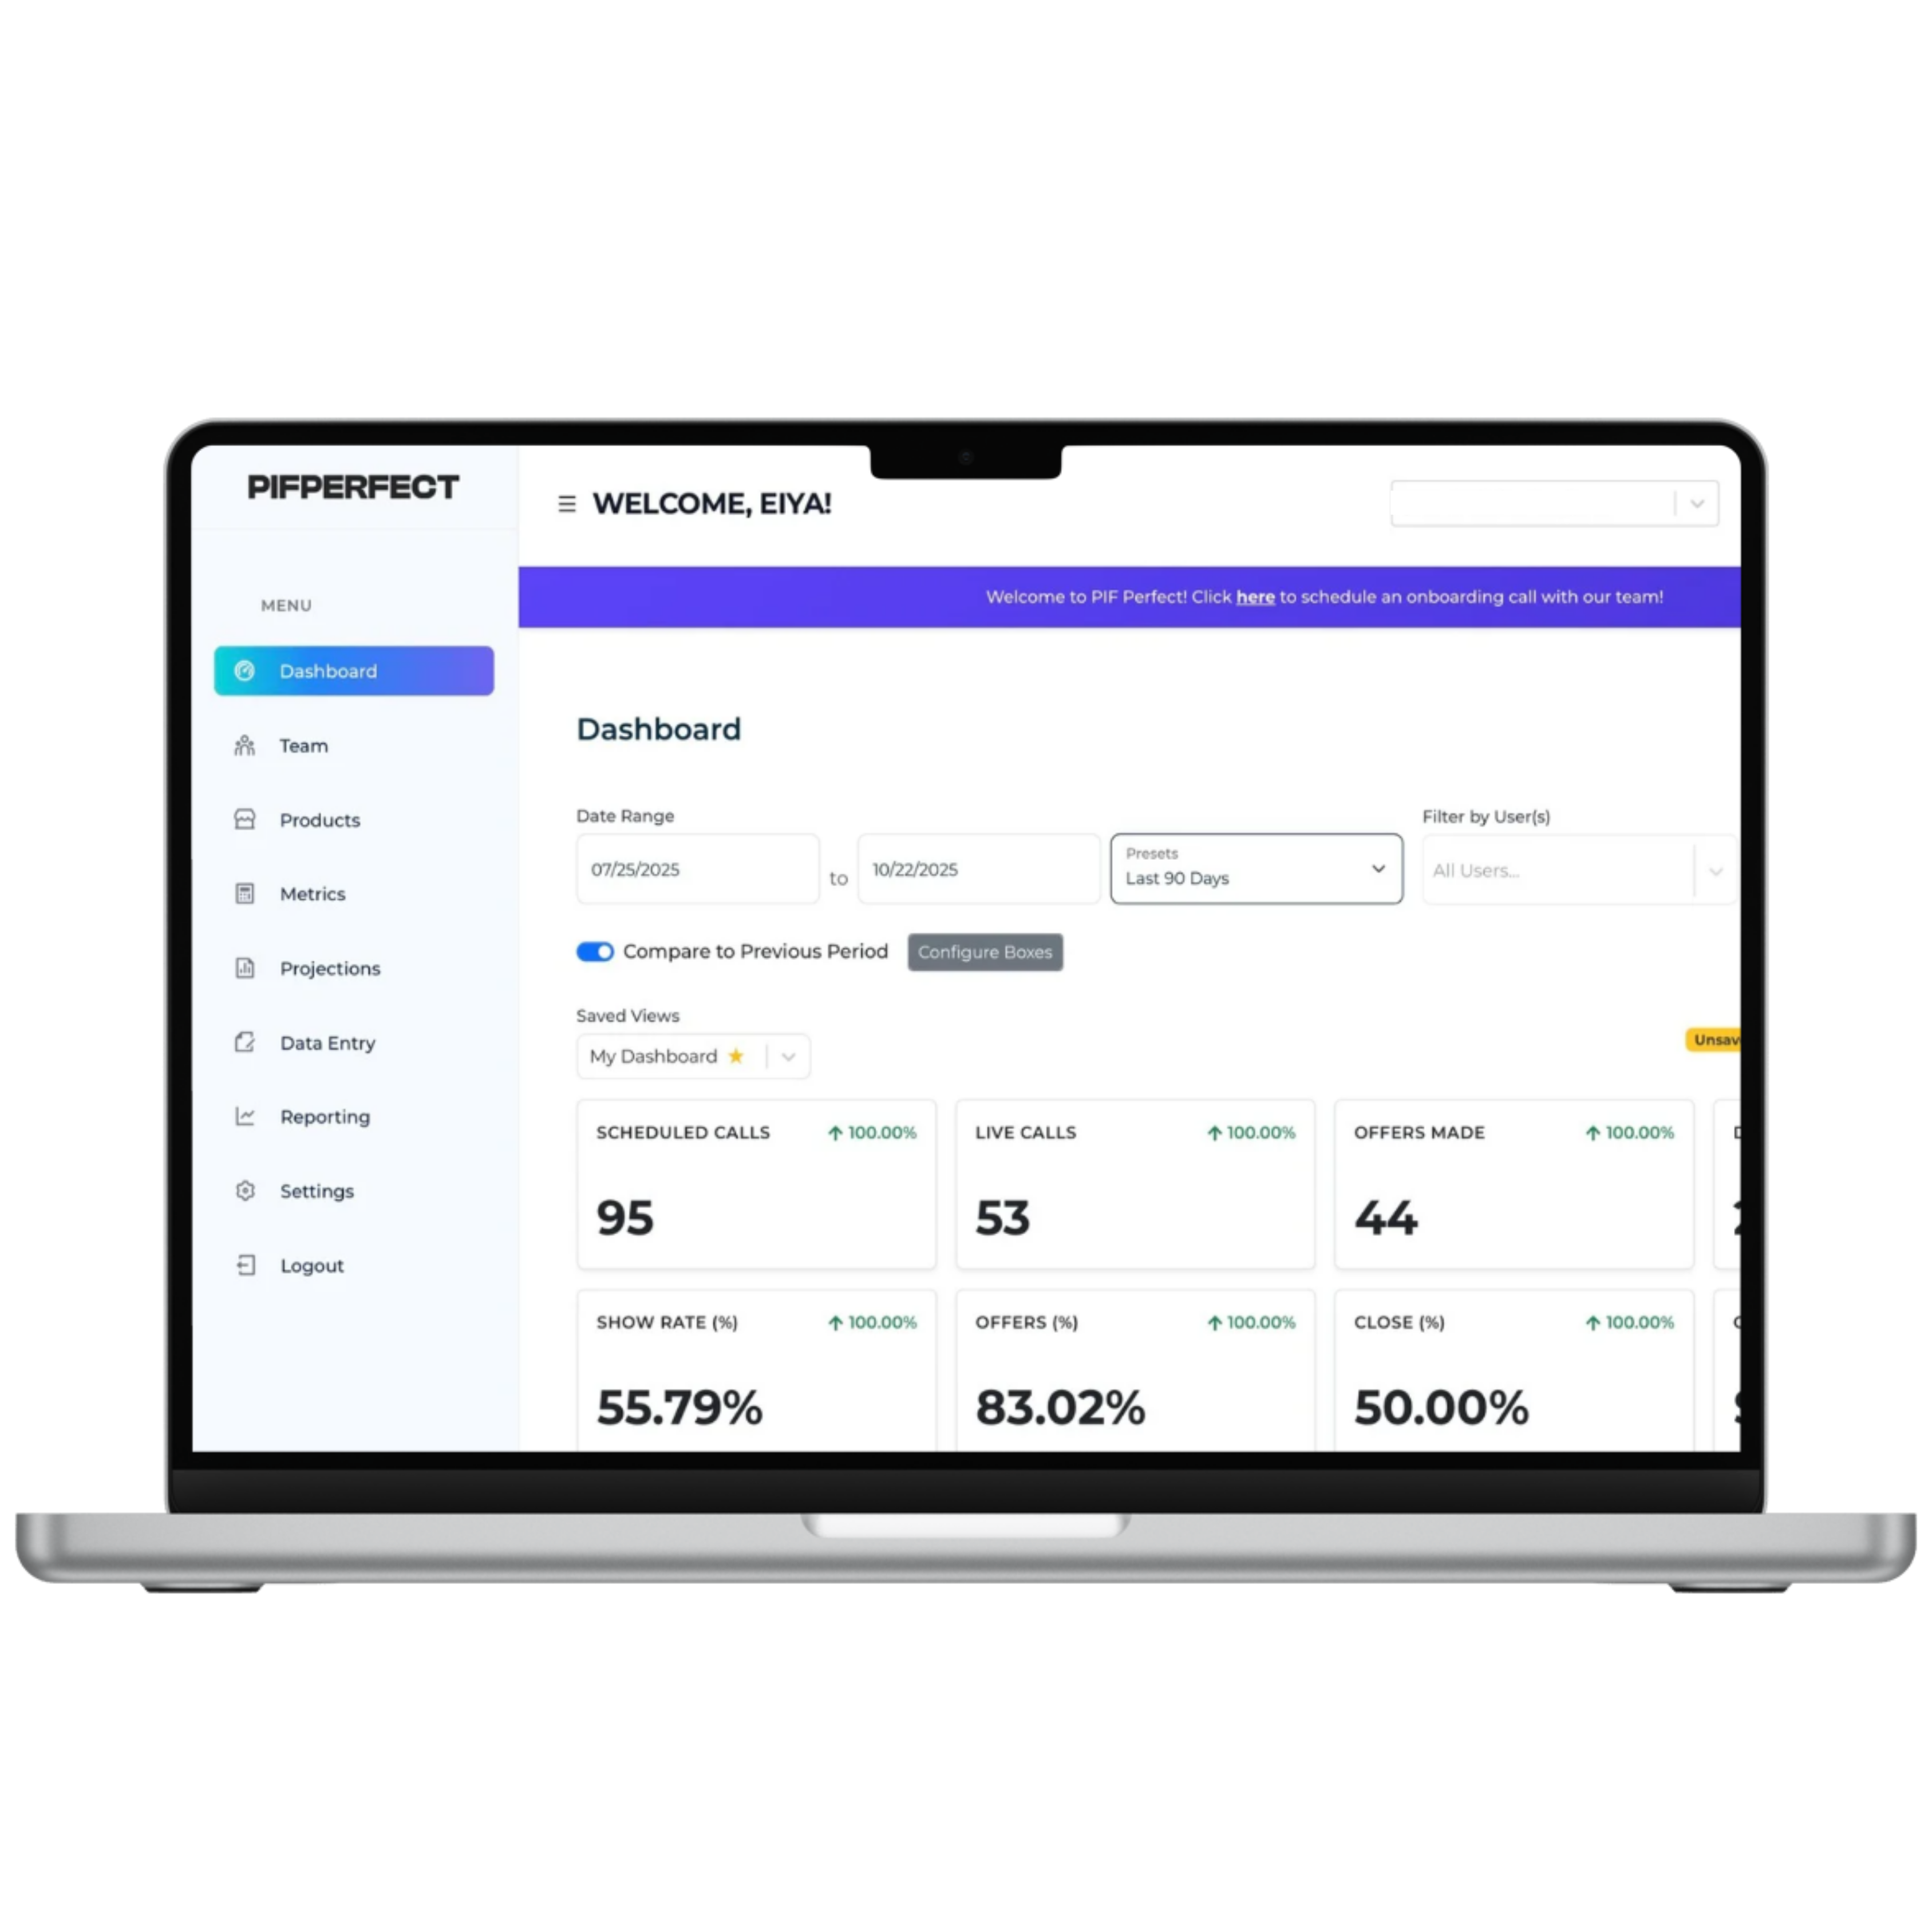
The tool you use matters. If you're trying to do this in a spreadsheet, you'll likely stall somewhere around week 2 when the formula complexity outpaces your patience. A purpose-built system like PIF Perfect handles all five metrics automatically — reps submit in 30 seconds, and the calculations, leaderboards, and pacing projections update in real time.
But regardless of the tool, the principle is the same: a small set of metrics tracked every day will give you more management leverage than a large set of metrics tracked monthly. Focus on these five, get them right, and you'll see your team differently within a week.

PIFPerfect
Sales Performance, Perfected
Your team submits daily numbers in 30 seconds. You get real-time dashboards, AI insights, and the coaching data to build a team that wins — every single day.
Start Your 14 Day Free Trial, Cancel Anytime